
At its core, calculating marketing ROI is pretty simple. You take the revenue a campaign generated, subtract what you spent on it, and then divide that number by the cost.
That’s it. This quick calculation gives you a clear, tangible number that shows exactly how much you get back for every dollar you spend. It’s the single most important metric you have for proving marketing’s value.
Why Marketing ROI Is Your Most Important Metric
Let’s be honest—in many businesses, marketing can feel like a cost center until you can prove otherwise. Without concrete numbers, asking for a bigger budget can feel like a shot in the dark. Justifying your team’s hard work to leadership becomes a constant battle.
This is where understanding marketing ROI completely changes the game. It’s not just about a formula; it’s about shifting the entire perception of marketing from an “expense” to a strategic, revenue-driving engine.
When you can confidently draw a straight line from your campaigns to actual sales, you’re no longer just talking about clicks and impressions. You’re talking about how a specific ad spend led to a direct increase in the company’s bottom line. That’s a conversation that gets attention and empowers you to make smarter, data-backed decisions.

From Cost Center To Revenue Driver
Having a clear handle on your ROI gives you undeniable proof of marketing’s contribution. Suddenly, you can:
- Justify Budgets with Confidence: Walk into a meeting and show executives exactly what they can expect in return for their investment. No more guessing.
- Optimize Your Spending: Pinpoint which channels are giving you the best bang for your buck and reallocate funds away from the ones that aren’t pulling their weight.
- Earn a Seat at the Table: When you start speaking the language of revenue and profit, you become an essential part of the company’s growth strategy.
Mastering your Marketing ROI is the key to evaluating and optimizing everything you do. It’s the ultimate indicator of an effective marketing strategy for small business success and the foundation for demonstrating real value.
The Foundational ROI Formula
The conversation always starts with the classic, simple formula. It has been around for a while, but its simplicity is why it’s still so common.
The most widely used calculation is: ROI = (Revenue from Marketing – Marketing Cost) / Marketing Cost.
Let’s say you spend $10,000 on a campaign that drives $100,000 in new sales. Your ROI would be 900%. This straightforward metric became a cornerstone for quantifying marketing’s financial impact back in the early 2000s and remains a critical starting point.
Here’s a quick breakdown of what goes into that calculation.
The Basic Marketing ROI Formula at a Glance
This table summarizes the fundamental components you’ll need for a quick ROI calculation.
| Component | Description | Example Value |
|---|---|---|
| Revenue from Marketing | The total sales revenue directly from the campaign. | $100,000 |
| Marketing Cost | The total amount spent to run the campaign. | $10,000 |
| The Calculation | (Revenue – Cost) / Cost | 900% |
While this formula gives you a great starting point, the real magic happens when you understand the nuances behind these numbers.
But this simple calculation is just the beginning. True mastery lies in understanding the nuances behind the numbers, which is crucial for anyone wondering how to measure digital marketing success. Our guide will walk you through every step.
Gathering the Right Data for an Accurate ROI
An ROI calculation is only as good as the data you feed it. Before you even think about plugging numbers into a formula, you have to get your inputs right. The old saying “garbage in, garbage out” has never been more true than when calculating your marketing return.
This means meticulously tracking down every single cost tied to a campaign and every dollar of revenue it generates. A misstep here can send you in the wrong direction, causing you to either overvalue an underperforming channel or kill a campaign that was actually working wonders.
Identifying Every Marketing Cost
To get a true picture of your investment, you need to look far beyond just your ad spend. Too many marketers make the mistake of only tracking the most obvious expenses, which leads to a dangerously inflated and inaccurate ROI. A comprehensive cost analysis is the foundation of a defensible calculation.
Think of your total marketing investment as having several layers.
Direct Costs are the most straightforward expenses tied directly to a specific campaign.
- Ad Spend: The money you pay platforms like Google, Meta, or LinkedIn to run your advertisements.
- Agency Fees: Retainers or project-based fees paid to external marketing agencies or freelancers.
- Content Creation: Costs for producing assets like blog posts, videos, or graphics—this includes payments to writers, designers, or videographers.
Indirect Costs are often overlooked but are just as critical for an accurate ROI.
- Software and Tools: Subscriptions for your marketing stack, such as your email marketing platform, SEO tools, analytics software, or your CRM.
- Team Salaries: A portion of your marketing team’s salaries allocated to the time they spent on the campaign. For example, if a team member earning $60,000 a year spends 10% of their time on a specific campaign, you should attribute $6,000 of their salary as a cost.
Tracking these “hidden” costs is what separates a surface-level ROI from a truly accurate one. Forgetting to account for the monthly cost of your marketing automation software or the hours your team invested can make a campaign look far more profitable than it actually is.
Connecting Revenue to Marketing Efforts
Once you have a handle on your costs, the next challenge is to accurately attribute revenue. This is all about connecting specific sales directly to the marketing campaigns that drove them. Your CRM and analytics platforms are your best friends here.
Setting up proper tracking is completely non-negotiable. This means using tools and techniques that follow a user from their very first interaction with your marketing all the way to their final purchase. Without this, you’re just guessing which efforts are paying off.
You can use several methods to make sure you’re connecting the dots correctly:
- UTM Parameters: Use these tags in your URLs to track the source, medium, and campaign name for every visitor. This data flows directly into your analytics, showing you exactly which links are driving traffic and conversions.
- Conversion Tracking: Set up conversion goals in your analytics platform to monitor key actions, like form submissions, demo requests, or completed purchases.
- CRM Integration: Ensure your marketing platforms are integrated with your CRM. This closes the loop, allowing you to see when a lead generated from a specific campaign becomes a paying customer.
Here’s an example of what your revenue data might look like inside an analytics dashboard.
This kind of view allows you to see which specific campaigns are generating the most revenue, providing clear, hard data to feed right into your ROI formula. For a deeper dive into making sense of this data, explore our guide on understanding Google Analytics 4 key reports for data-driven insights.
Choosing an Attribution Model That Fits Your Business
Before you can get a real handle on your marketing ROI, you have to answer one deceptively simple question: which channel gets the credit for a sale?
The modern customer journey is never a straight line. A buyer might see a social media post, click a search ad a week later, and finally pull the trigger after getting an email campaign. So, who’s the hero? This is where attribution models come in, and picking the wrong one can completely throw off your numbers.
https://www.youtube.com/embed/aiCbgnOavT0
An attribution model is just a set of rules for assigning credit to the different touchpoints a customer interacts with on their way to making a purchase. Without a clear model, it’s easy to fall into the trap of overvaluing that final click and totally ignoring all the crucial brand-building and nurturing that got the customer there in the first place.
The right model doesn’t just give you a number; it tells you the real story of how your marketing efforts create value over time.
This is the fundamental flow you’re trying to map out. You need to connect your marketing spend to actual business outcomes, and the attribution model is the brain of that entire operation.
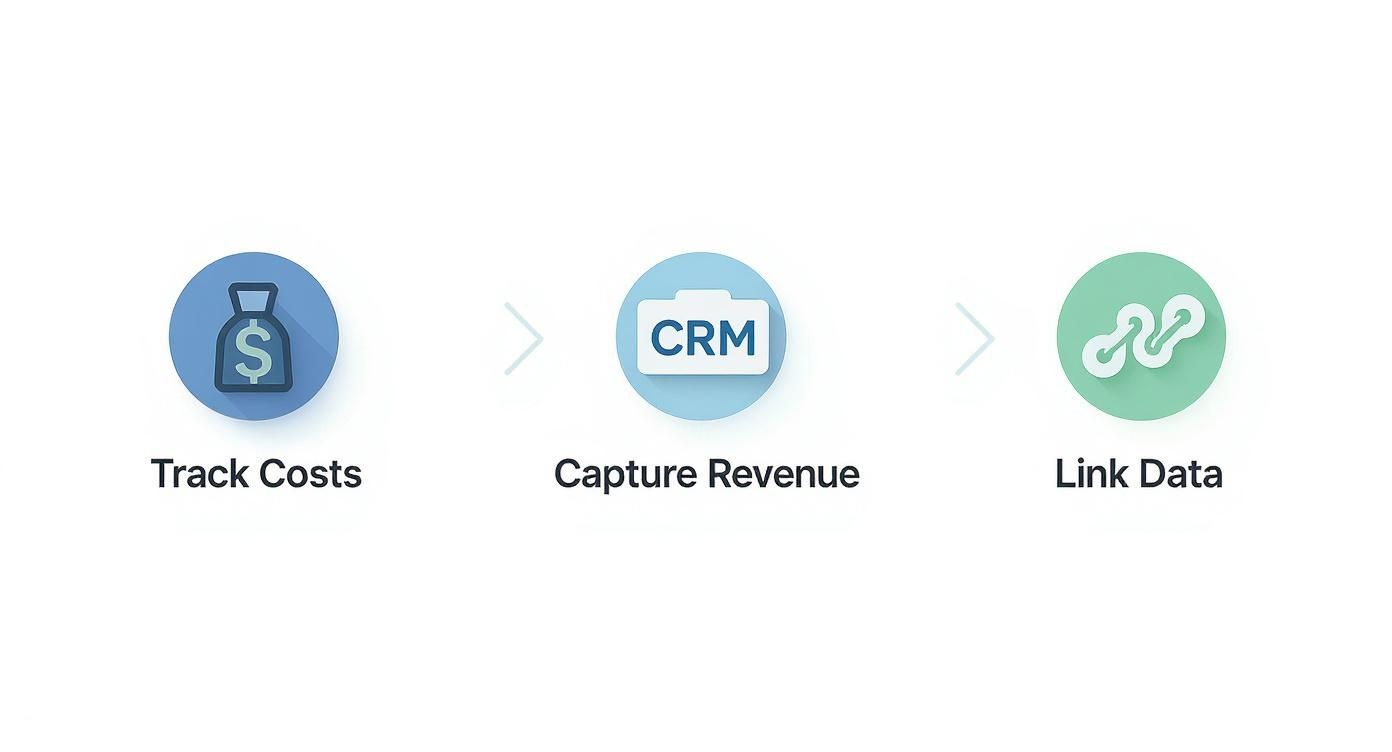
As you can see, the process is logical: track your costs, capture your revenue, and then link the two. Your attribution model is what powers that “linking” step, defining how those connections are made.
Comparing Common Marketing Attribution Models
Different businesses need different lenses to view the customer journey. An e-commerce brand that lives and dies by flash sales has completely different attribution needs than a B2B SaaS company with a six-month sales cycle. There’s no single “best” model—only the one that best reflects how your customers actually behave.
To help you find the right fit, let’s break down the most common models, how they work, and where they shine (or fall short).
| Attribution Model | How It Works | Best For | Potential Drawback |
|---|---|---|---|
| First-Touch | Gives 100% of the credit to the very first marketing touchpoint. | Businesses focused on top-of-funnel awareness and demand generation. | Ignores the impact of all mid- and bottom-funnel activities that close the deal. |
| Last-Touch | Gives 100% of the credit to the final touchpoint before a conversion. | E-commerce or campaigns designed to drive immediate action with a short sales cycle. | Drastically undervalues awareness-building and nurturing channels. |
| Linear | Distributes credit equally across all touchpoints in the journey. | Getting a balanced, high-level view of every channel’s contribution. | Can assign equal importance to a minor touchpoint and a major one. |
| Time-Decay | Gives more credit to touchpoints that happened closer to the conversion. | Longer B2B sales cycles where the final interactions are often most influential. | May undervalue the initial touchpoint that started the entire journey. |
Choosing a model isn’t just a technical task; it’s a strategic one that shapes your entire marketing budget and focus. A last-touch model might make you think your content marketing is failing, while a first-touch model could cause you to cut a retargeting ad that’s actually a closing powerhouse.
How To Select The Right Model For Your Business
So, how do you pick one? It all starts with a hard look at your customer behavior and the typical length of your sales cycle.
A B2B company might find a Time-Decay or Linear model is the most honest reflection of their reality because it can take months of nurturing to close a high-value deal. On the other hand, an e-commerce store running a 24-hour sale might find that a Last-Touch model is perfectly fine because the path from ad to purchase is incredibly short. For a much deeper dive into this, check out our guide on cross-channel marketing attribution.
More and more, we’re seeing sophisticated, data-driven models emerge to handle today’s messy customer journeys. These systems use machine learning to analyze every path—both converting and non-converting—to figure out which touchpoints truly make a difference.
For instance, a platform like Ruler Analytics can map out the entire user journey and distribute credit far more intelligently than a simple rule-based model. This helps you finally quantify the value of those top-of-funnel activities that build brand awareness but often get zero credit in a last-click world.
Ultimately, your goal is to find a model that gives you the most accurate and actionable insights. You want a clear picture that helps you confidently invest your marketing dollars where they’ll have the greatest impact.
All right, you’ve gathered your data and picked an attribution model. Now comes the fun part: crunching the numbers and seeing what’s really working. This is where we move from theory to practice, translating all that hard work into the language of business growth.
We’ll kick things off with the classic ROI formula everyone knows, but we won’t stop there. The real magic happens when you layer in more advanced calculations that give you a much clearer, more honest picture of your marketing’s profitability and long-term impact.

The Classic Marketing ROI Formula
This is your starting line. The standard formula gives you a quick, direct answer to the fundamental question: “For every dollar we spent, how much did we get back?” It’s simple, powerful, and the perfect first step for any campaign analysis.
The formula is: (Sales Growth – Marketing Cost) / Marketing Cost
Let’s say a local bakery in Baltimore runs a $2,000 social media campaign for a new line of seasonal pastries. At the end of the month, they see the campaign drove $10,000 in new sales.
- Calculation: ($10,000 – $2,000) / $2,000 = 4
- Result: That’s a 400% ROI.
Put simply, for every $1 the bakery invested, they generated $4 in revenue. This is a clean, compelling number you can take straight to your team or stakeholders.
Moving Beyond Revenue to Gross Profit
While the classic formula is a great snapshot, it has a major blind spot—it completely ignores the cost of what you’re selling. A high-revenue campaign can still lose money if your profit margins are thin.
That’s why savvy marketers quickly graduate to using gross profit. This gives you a far more accurate view of profitability. For example, if a campaign pulls in $80,000 in revenue but the cost of goods sold (COGS) was $40,000, your gross profit is only $40,000. If you spent $10,000 on marketing, the ROI based on profit is ($40,000 – $10,000) / $10,000 = 3, or 300%. As detailed in these insights on marketing ROI from Sprinklr.com, this is a much truer measure of success.
Let’s go back to our bakery:
- The campaign generated $10,000 in sales.
- But the ingredients and labor (COGS) to make those pastries cost $4,000.
- This means their gross profit was actually $6,000.
- The marketing cost was still $2,000.
With this new information, the calculation changes: ($6,000 – $2,000) / $2,000 = 2.
The ROI is actually 200%. It’s still a win, but this number is grounded in reality and reflects the campaign’s true financial impact.
Calculating Your Customer Acquisition Cost
The next layer of insight comes from figuring out how much it costs to bring one new customer through the door. This is your Customer Acquisition Cost (CAC), a crucial metric for judging the efficiency of your spending at a much more granular level.
The formula is straightforward: Total Marketing and Sales Costs / Number of New Customers Acquired
Imagine a local law firm spends $15,000 on a targeted PPC campaign over a quarter. From that effort, they sign 30 new clients.
- CAC Calculation: $15,000 / 30 = $500 per new client.
Knowing this number is non-negotiable. It tells you exactly what you’re paying to get a new client, which is the first half of a very important equation.
Your CAC is an early warning system. If you see it creeping up, it could mean a channel is getting too crowded or your messaging is starting to fall flat.
The Power of Customer Lifetime Value
Finally, we get to the most strategic metric of all: Customer Lifetime Value (LTV). LTV shifts your focus from a single sale to the total revenue a customer will likely generate over their entire relationship with your business. It answers the big question: “What is this new customer really worth to us over the long haul?”
A simple way to calculate it is: (Average Purchase Value) x (Average Purchase Frequency) x (Average Customer Lifespan)
Let’s check in with our law firm again:
- The average client pays them $2,000 per year.
- Clients typically stick around for 5 years.
- LTV Calculation: $2,000 x 5 = $10,000.
Now we can see the full story. The firm spends $500 to acquire a client who is worth $10,000 over their lifetime. That’s a phenomenal return.
This is exactly why the LTV:CAC ratio is the gold standard for investors and growth-focused marketers. A healthy ratio (usually 3:1 or higher) is a clear signal of a sustainable, profitable business model. It proves you have a repeatable engine for growth.
Interpreting Your Results: Beyond the Numbers
Figuring out the math is one thing. Actually understanding what that number means for your business? That’s where the real skill comes in.
A raw ROI figure, floating in a spreadsheet without any context, can be dangerously misleading. I’ve seen teams celebrate a 5:1 ratio that was barely breaking even, while others dismissed a 3:1 that was setting them up for massive long-term growth. Context is everything.
Too many marketers get the number, drop it in a report, and call it a day. But the real pros know the insight comes from digging deeper—from understanding the nuances and sidestepping the common traps that lead to terrible budget decisions.
Beyond a Single Number: What ROI Is Really Telling You
Think of your ROI not as a final grade, but as a diagnostic tool. A “good” ROI is completely relative. It all depends on your industry, your profit margins, and what you’re trying to achieve.
A high-volume, low-margin e-commerce store might need a 10:1 ROI just to stay profitable. On the other hand, a B2B SaaS company with high margins could be thrilled with a 3:1 ROI, knowing that each new customer is incredibly valuable over the long haul.
The key is to benchmark your results. You need to compare your campaign’s performance against something meaningful:
- Your Own Past Campaigns: Is this better or worse than the last email push? What did we change?
- Industry Averages: How are we stacking up against the competition? Research from Demandbase often points to a 5:1 ratio as a solid benchmark, but this can vary wildly.
- Performance by Channel: What’s a good ROI for a Google Ads campaign versus a TikTok influencer push? Every channel has its own baseline for success.
This kind of comparison is what turns a simple number into actionable intelligence. It shows you exactly where your marketing budget is pulling its weight.
Common Pitfalls That Distort Your True ROI
Even with the best intentions, it’s easy to fall into traps that warp your perception of a campaign’s success. Just being aware of these pitfalls is the first step toward making smarter, data-driven decisions.
One of the biggest mistakes I see is an obsession with short-term wins. A flashy PPC campaign might deliver an amazing ROI in its first month, but if it only attracts one-and-done customers with low lifetime value, was it really a win? On the flip side, foundational efforts like content marketing or SEO often have a low (or even negative) initial ROI. But they’re busy building a pipeline of high-quality leads that will pay off for years.
Another huge problem is using a flawed attribution model. As we’ve covered, if you’re only looking at the last touchpoint, you’ll always undervalue the channels that introduced and nurtured your leads. You might end up cutting the budget for the very top-of-funnel activities that fill your pipeline, effectively kneecapping your future growth.
A campaign with a lower initial ROI might actually be your most valuable long-term asset. This often happens when a specific effort, like a detailed webinar series, attracts customers who, while slower to convert, have a much higher lifetime value.
The Hidden Value in “Lower” ROI Campaigns
Let’s walk through a real-world scenario. Imagine you run two different campaigns:
- Campaign A (PPC): You spend $5,000 and generate $25,000 in immediate sales. That’s a fantastic 400% ROI. The catch? The customers are mostly first-time buyers who you never see again.
- Campaign B (Content): You spend the same $5,000 on an in-depth guide that only brings in $15,000 in initial sales for a 200% ROI. But when you look at the data, you see these customers make repeat purchases and upgrade their plans over time.
On the surface, Campaign A looks like the hands-down winner. But when you bring Customer Lifetime Value (LTV) into the picture, the story completely flips. The customers from Campaign B might have an LTV that is five times higher than those from Campaign A. To really see the full picture, you need to know how to increase customer lifetime value and track it right alongside your campaign ROI.
This long-term perspective reveals that Campaign B, despite its lower initial return, is the far smarter investment for building a sustainable, profitable business.
Tools and Tactics to Continuously Improve Your ROI
So, you can now calculate and interpret your marketing ROI. That’s a huge step, but the real work starts now. The goal isn’t just to generate a one-time report; it’s to create a continuous cycle of measuring, analyzing, and optimizing. This is how you make every single marketing dollar work harder for you.
Of course, using the right tools makes this whole process much smoother. All-in-one platforms like HubSpot are great for centralizing your data, while more specialized analytics software can give you a much deeper look into customer behavior. These tools handle the heavy lifting of data collection and reporting, freeing you up to focus on strategy.
Turning Data Into Decisions
A pile of data is useless if it doesn’t lead to better decisions. Your ROI analysis should be the blueprint for how you allocate your budget and tweak your campaigns. It’s all about creating a clear framework that turns numbers into tangible actions that actually boost performance.
Start by sorting out your winners and losers. If the data shows that one channel consistently delivers a high return, that’s a bright green light to double down on it. On the flip side, if a channel is underperforming, you’ve got a tough decision to make: can it be fixed, or is it time to pull the plug and move those funds elsewhere?
This kind of dashboard view is perfect for visualizing performance across different campaigns, letting you spot the high and low performers at a glance.

The key takeaway here is the direct comparison between what a campaign costs and the revenue it brings in. This makes rapid budget reallocation a much more confident, data-backed process.
A Framework for Optimization
Once you’ve spotted the opportunities, the real fun begins. This is where you shift from just analyzing to actively optimizing, using what you’ve learned to guide every tactical choice. It’s about getting into a rhythm of continuous improvement.
Your optimization framework should be built on a few core pillars:
- A/B Testing: Your ROI data is the perfect source for new hypotheses. If a certain ad creative is crushing it, test variations of it. Can you make a good thing even better?
- Budget Reallocation: Be ruthless but smart. Shift your budget from low-ROI activities to your proven winners. This isn’t about cutting costs; it’s about investing your money where it will grow fastest.
- Personalization: To keep pushing your ROI higher, implementing effective personalized marketing strategies to boost ROI is a game-changer. It’s a powerful way to maximize returns and keep your audience engaged.
The best marketing teams I’ve ever seen operate in a constant feedback loop. They measure results, pull out the key insights, make changes, and then measure all over again. This iterative process is the engine that drives sustainable growth.
Often, this cycle of refinement brings you back to the user experience on your landing pages and website. Even small tweaks can lead to surprisingly big gains in conversion rates, which directly juices your ROI. If you’re looking for more ideas, these expert conversion rate optimization tips are a great place to start.
By establishing this rhythm, you stop treating ROI as a historical number and start using it as a forward-looking guide for everything you do next.
Your Top Marketing ROI Questions, Answered
We’ve walked through the formulas, tools, and the bigger picture. But when the rubber meets the road, real-world questions always pop up. Let’s tackle some of the most common ones I hear from clients when they start calculating marketing ROI for the first time.
What’s a Good Marketing ROI Ratio, Anyway?
Everyone wants a magic number, but the truth is, there isn’t one. The classic benchmark you’ll hear tossed around is a 5:1 ratio—that means earning $5 in revenue for every $1 you spend on marketing. It’s a solid goal to aim for.
But context is absolutely everything. A high-growth SaaS startup might be thrilled with a 3:1 ratio if it means they’re aggressively capturing market share. On the other hand, an established e-commerce brand with razor-thin margins might need to see a 10:1 ratio to actually turn a profit.
Expert Tip: Stop chasing a universal “good” ROI. Your best benchmark is your own historical performance. Set your targets based on improving your past results and what’s realistic for your specific industry.
How Often Should I Be Calculating This?
The right cadence depends entirely on your business’s rhythm—specifically, your sales cycle and campaign duration.
If you’re running a fast-moving e-commerce store with weekly ad campaigns, you should be looking at your ROI weekly or, at the very least, monthly. You need that quick feedback loop to make timely tweaks and avoid burning cash on what isn’t working.
But for a B2B company where the sales cycle can stretch over months, a quarterly review makes a lot more sense. Checking too frequently would be like pulling a plant out of the ground to see if the roots are growing—you’ll just get noisy, incomplete data and make bad decisions. The goal is a consistent schedule that gives you enough data to act on confidently.
How Do I Even Measure the ROI of SEO or Content Marketing?
This is the million-dollar question for long-game strategies like SEO and content marketing. It’s trickier, for sure, but absolutely doable. You just have to shift your focus from immediate sales to leading indicators of success.
Since a blog post rarely leads to a direct, immediate purchase, you need to track the metrics that build toward revenue over time.
Focus on things like:
- Clear growth in your organic traffic and keyword rankings.
- The number of leads generated from organic channels, like when someone downloads an ebook or signs up for a webinar.
- “Assisted conversions” that show up in your analytics, where content played a role early in a customer’s journey.
By assigning a value to these leads and then tracking their journey to becoming a customer over a longer timeframe, you can draw a clear line from your SEO and content efforts straight to the revenue they generate.
Ready to stop guessing and start proving the value of your marketing? The team at Raven SEO provides data-driven strategies to help businesses in Baltimore and beyond measure and improve their digital marketing ROI. Schedule your no-obligation consultation today and get a clear roadmap for growth.