Measuring digital marketing performance is all about using data to figure out if your online marketing is actually working and making you money. It's an educational process of tracking the right numbers—the ones tied to your business goals—and looking past the flashy, superficial stats to understand what's truly driving revenue and growth.
Beyond Vanity Metrics: What Actually Matters
Have you ever gotten excited about a huge spike in website traffic, only to see your sales numbers stay completely flat? It’s a classic case of the "marketing data mirage," a common trap where impressive-looking numbers like likes, clicks, and impressions create a false sense of victory. Too many businesses are drowning in data but starved for real, actionable insights.
The key is learning to tell the difference between vanity metrics and actionable metrics. Vanity metrics feel good, but they don't help you make better decisions. Actionable metrics, on the other hand, connect directly to business outcomes like qualified leads, customer acquisition cost, and, most importantly, revenue.
The Problem with Surface-Level Data
Focusing only on surface-level activity can be seriously misleading. A recent report really puts a spotlight on how unreliable these signals can be. The study found that a staggering 87% of organizations report their marketing investments produce inflated "intent signals"—things like clicks and downloads that look promising but never convert.
Even more shocking? Only 26% of these supposed "intent" signals ever turn into qualified opportunities.
This data drives home a critical point: a click is not a customer. To build a sustainable growth engine, you have to connect every marketing dollar to a real result. This means moving from passively collecting data to actively analyzing performance. To really measure what's working, you need a data-driven growth plan that prioritizes profit over vanity metrics—a principle that applies everywhere, from a local plumbing business to a data-driven Amazon sales growth plan.
"The goal is to turn data into information, and information into insight." – Carly Fiorina, former CEO of Hewlett-Packard
This guide is your roadmap for building a measurement framework that fuels smarter decisions. You'll learn how to pinpoint the numbers that matter and use them to fine-tune your strategy for real, measurable growth. Shifting your focus from high traffic to high-quality conversions is essential, and our guide on conversion rate optimization tips provides actionable strategies to help you make that change.
The infographic below really nails this crucial shift—moving from tracking simple clicks to focusing on what truly drives business success: leads and revenue.
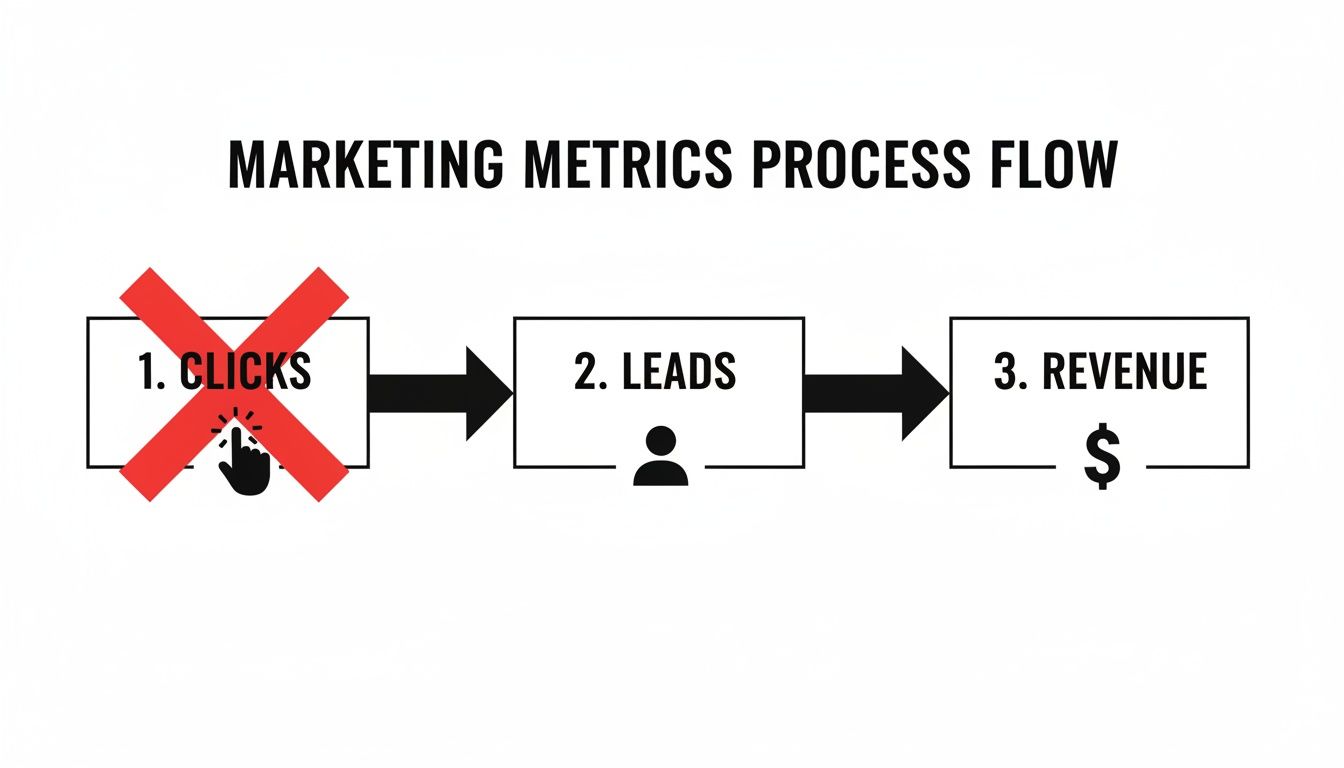
This visual is a great reminder that while clicks might kick off the journey, your measurement focus needs to stay locked on the outcomes that directly impact your bottom line.
Building Your Measurement Foundation
If you think marketing measurement starts with opening a dashboard, you're already behind. Effective measurement begins long before you look at a single chart—it starts with clear, strategic goals. This is the foundation that connects your marketing spend directly to your company's bottom line. Without it, you're just tracking vanity metrics. With it, you're actually measuring what matters.
The first step is a crucial mental shift: stop thinking about marketing goals and start thinking about business objectives. A local law firm's goal isn't just to get more website traffic; it's to book more qualified consultations. An ecommerce store isn't just trying to make a sale; it's trying to increase the total Customer Lifetime Value (CLV). Each of these requires a completely different way of measuring success.

From Business Goals to SMART Objectives
To make those big business objectives actionable, you need to break them down into SMART goals. This isn't just corporate jargon; it's a proven framework that turns vague ambitions into a clear, trackable roadmap.
- Specific: Nail down exactly what you want to achieve. "Get more leads" is a wish. "Generate 20 qualified leads per month from our Google Ads campaign" is a target.
- Measurable: You have to be able to track it. How will you know you're making progress? A goal like "increase organic website traffic by 15%" gives you a clear benchmark.
- Achievable: Be honest about what's realistic with your current resources. Setting an attainable target keeps your team motivated instead of discouraged.
- Relevant: Does this goal actually move the needle for your business? If your main objective is local lead generation, pouring a ton of money into a national brand awareness campaign probably isn't the right move.
- Time-bound: Give yourself a deadline. Adding "by the end of Q3" creates a sense of urgency and a clear finish line for evaluation.
Setting SMART goals is the difference between saying "I hope our marketing works better" and "We will reduce our Customer Acquisition Cost by 10% in the next six months." One is wishful thinking; the other is a plan.
Part of building a solid measurement strategy is knowing what your team is capable of. Using an analytics maturity model can help you assess your current capabilities and set goals that are challenging but truly achievable.
Selecting the Right KPIs for Each Channel
Once your SMART goals are locked in, it's time to pick the right Key Performance Indicators (KPIs) to watch. A KPI is a specific, measurable value that shows you how effectively you're hitting those key business objectives. The right KPIs will look very different depending on which marketing channel you're measuring.
Let's take a real-world example. Imagine a Baltimore-based home services company. Their big-picture goal is to book 30 new service appointments every month. Here’s how they could translate that into channel-specific KPIs:
- Local SEO: Their most important KPI would be the number of 'Request a Quote' form submissions coming from organic search. Secondary KPIs might include tracking phone calls from their Google Business Profile or monitoring rankings for terms like "plumber in Baltimore."
- Paid Social (Facebook Ads): Here, the primary KPI is Cost Per Lead (CPL) for anyone who fills out a lead form directly on the platform. Other metrics like Click-Through Rate (CTR) and ad frequency are useful for diagnosing the health of the campaign itself.
Choosing the right KPIs isn't about tracking everything; it's about tracking the right things—the metrics that directly reflect progress toward your specific goals. Sure, it's useful to know your overall numbers, but learning how to track website traffic from the specific sources that actually convert is what gives you actionable insight.
Matching your business goals to the right marketing KPIs is a critical exercise. The table below illustrates how different types of businesses can translate their objectives into tangible, trackable metrics across various channels, ensuring that every marketing action is measured against a meaningful outcome.
Matching Business Goals to Marketing KPIs
| Business Goal | Example Business Type | Key Marketing Channel | Primary KPI | Secondary KPI |
|---|---|---|---|---|
| Increase Local Leads | Maryland Law Firm | Local SEO | Number of Consultation Forms Submitted | Organic Keyword Rankings for "baltimore injury lawyer" |
| Drive In-Store Foot Traffic | Baltimore Coffee Shop | Paid Social (Instagram Ads) | In-Store Offer Redemptions | Ad Reach within a 5-mile radius |
| Increase Online Sales | Ecommerce Clothing Store | Google Ads (Shopping) | Return On Ad Spend (ROAS) | Shopping Cart Abandonment Rate |
| Generate Qualified B2B Leads | B2B Software Company | Content Marketing (LinkedIn) | Number of Demo Requests from Gated Content | Cost Per Lead (CPL) |
| Boost Customer Loyalty | Local Subscription Box Service | Email Marketing | Customer Lifetime Value (CLV) | Repeat Purchase Rate |
This table serves as a starting point. The key is to constantly ask: "Does this metric truly reflect progress toward my primary business objective?" If the answer is no, it's a vanity metric, not a KPI.
Setting Up Your Analytics Toolkit
Okay, you've mapped out your goals. Now it's time to roll up our sleeves and get the technical foundation right. This is where we build the engine that will actually measure your marketing performance, capturing every click, sign-up, and sale.
Don't let the word "technical" scare you off. We're not diving into complex code. The goal is to set up a few non-negotiable tools that ensure the data you collect is clean, accurate, and trustworthy. Get this part wrong, and you're just guessing. Get it right, and you'll have a clear view of what's actually working.
![]()
Mastering Google Analytics 4 for Modern Tracking
Let's start with the big one: Google Analytics 4 (GA4). It’s the new standard for a reason. Unlike its predecessor, which was all about pageviews, GA4 uses an event-based model. This is a huge shift. It means you're tracking specific actions people take on your site—clicking a button, watching a video, or filling out a form.
For an ecommerce store, this means you can see the whole journey: someone adds a product to their cart, starts the checkout process, uses a promo code, and finally makes a purchase. Each step is a trackable event. For a local plumber, you can track every time someone clicks the "Call Now" button on their phone or submits a "Request an Estimate" form.
Getting GA4 running properly is your first real task. It boils down to a couple of key steps:
- Install the GA4 Tag: This is a small snippet of code that needs to be on every page of your website. The easiest way to manage this is with Google Tag Manager.
- Define Your Conversion Events: Once the tag is installed, you need to tell GA4 what winning looks like for your business. Go into your GA4 account and mark your most important events (like
generate_leadorpurchase) as official conversions.
Don't just install GA4 and walk away. The platform's real power is unlocked when you customize it to track the actions that directly align with your business goals. A generic setup will only give you generic, and frankly, unhelpful data.
Properly configuring GA4 is fundamental. To get the most out of it, you’ll want to get comfortable with its reports. You can learn more by exploring our guide on understanding Google Analytics 4 key reports for data-driven insights.
The Power of UTM Parameters for Source Tracking
Have you ever looked at your analytics report and seen a huge chunk of traffic labeled "direct/none"? It’s a black hole of data, leaving you clueless about where those people actually came from. This is the exact problem UTM parameters solve.
UTMs are just simple tags you add to the end of a URL. They act like a GPS tracker, telling Google Analytics precisely how a visitor found you.
A URL with UTMs gives you clear answers on three key things:
- Source: Where did the traffic come from? (
google,facebook,newsletter) - Medium: What kind of marketing channel was it? (
cpc,social,email) - Campaign: Which specific promotion was it? (
spring_sale_2024,q4_promo)
So, instead of just dropping a plain link to your site in a Facebook ad, you’d use a special link that tells GA4 this person came from your "Spring Sale" campaign on Facebook. Suddenly, you can see exactly which ads are driving real traffic and conversions.
Google’s free Campaign URL Builder makes creating these links incredibly simple. Just fill in the fields, and it generates a perfectly tagged URL ready to use.
Installing Tracking Pixels for Paid Campaigns
If you’re spending money on ads with platforms like Meta (Facebook and Instagram) or LinkedIn, you absolutely must install their tracking pixels. These tiny bits of code are about way more than just counting conversions—they unlock the platforms’ most powerful features.
- Meta Pixel: This pixel connects your website activity back to your Facebook and Instagram ads. It’s what lets you accurately measure your Return on Ad Spend (ROAS), optimize your campaigns for conversions, and build powerful retargeting audiences of people who’ve already shown interest in your business.
- LinkedIn Insight Tag: For B2B marketers, this is essential. It enables conversion tracking for your LinkedIn ad campaigns and, even better, gives you incredible demographic data about your website visitors, like their job titles, industries, and company size.
Installing these pixels is a one-time setup that pays for itself almost immediately. It’s the bridge that connects your ad spend to actual business results, giving you the hard data you need to justify your budget and make smarter decisions. Without them, you’re just throwing money at ads and hoping something sticks.
Analyzing Your Channel Performance
With your analytics humming and clean data finally flowing in, you’re past the tedious part. Now for the fun part: interpretation. This is where you get to play detective and figure out which marketing channels are actually pulling their weight, which ones are assisting the winners, and which might just be burning a hole in your budget.
But it’s not as simple as looking at the last thing a customer clicked. The modern customer journey is a winding road, not a straight line.
A buyer might first stumble upon your brand through a Facebook ad, search for you on Google a week later, and finally pull the trigger after getting a promo email. If you only credit the email, you're blind to the crucial roles Facebook and Google played in getting them there. This is the core challenge of marketing attribution.
Understanding Marketing Attribution Models
Attribution is just a fancy word for assigning credit to the different marketing touchpoints that nudge a customer toward a conversion. Think of it like a soccer team—the striker gets the glory for scoring, but the midfielders who passed the ball were just as vital to the play.
Let's walk through a real-world scenario. Imagine a local home services company in Baltimore. A homeowner's path to booking a plumbing repair might look like this:
- Touchpoint 1: Sees a targeted Facebook ad for emergency plumbing services.
- Touchpoint 2: A week later, they search "best plumber in Baltimore" and click on the company's organic search result.
- Touchpoint 3: They sign up for the email list to grab a 10% off coupon.
- Touchpoint 4: Two weeks later, an email reminder pops up in their inbox, and they click through to book the service.
So, who gets the credit? It all depends on the model you use:
- First-Touch Attribution: Gives 100% of the credit to that first Facebook ad. This model is brilliant for figuring out which channels are best at generating initial awareness and getting your name out there.
- Last-Touch Attribution: Hands 100% of the credit to the final email click. It's the simplest model and often the default in many platforms, but it completely ignores everything that came before.
- Linear Attribution: Spreads the love equally. In our example, Facebook, organic search, and email would each get 33.3% of the credit. It’s a fair approach that acknowledges every touchpoint, though it treats them all as equally important.
- Data-Driven Attribution (DDA): This is the gold standard, available in platforms like Google Analytics 4. It uses machine learning to sift through thousands of conversion paths, assigning credit based on how much each touchpoint actually contributed. It might discover that for this business, the local SEO click was the single most influential step.
Choosing the right attribution model isn’t about finding one “correct” answer. It’s about painting a complete picture. A first-touch model shows you what starts the conversation, while a last-touch model reveals what closes the deal. Using them together gives you some seriously powerful strategic insights.
To really get into the weeds on this, check out our guide on cross-channel marketing attribution, which breaks these models down even further.
Digging into Channel-Specific Metrics
Once you have a grasp on attribution, you can start assessing individual channels with real confidence. It’s time to move past vanity metrics like traffic and focus on the numbers that actually hit your bottom line.
From a financial perspective, two metrics stand above all others: Cost Per Acquisition (CPA) and Return on Ad Spend (ROAS).
- Cost Per Acquisition (CPA): This tells you exactly what it costs to land one new customer from a specific channel. Just divide your total spend on that channel by the number of new customers it brought in. A low CPA means you’re running an efficient machine.
- Return on Ad Spend (ROAS): This measures the raw revenue you get back for every single dollar you put into advertising. If you spent $1,000 on Google Ads and it generated $5,000 in revenue, your ROAS is a solid 5x. This metric ties your ad budget directly to the cash register.
Getting this level of precision is more critical than ever. The digital marketing world is exploding—the market is projected to grow at a 9% CAGR from 2020-2026, with digital display advertising alone rocketing up by 15.5%. You can find more on these marketing statistics at Wordstream.com.
That kind of growth means more competition and more pressure to prove the value of every dollar. By zeroing in on metrics like CPA and ROAS, you can navigate this crowded space and ensure your investments are driving real growth, not just empty clicks.
Creating Actionable Reports and Dashboards
Having clean, reliable data is a huge win, but it’s only half the battle. Raw numbers sitting in a spreadsheet don’t drive growth; actionable insights do. This is where you transform your data from a collection of metrics into a compelling story that guides your next strategic moves.
The goal is to move beyond data dumps and create reports that people actually want to read and use.
That process starts with knowing your audience. The report you build for your CEO should look completely different from the one you create for your marketing manager. One needs a high-level snapshot of business impact, while the other needs granular details to optimize campaigns.
Tailoring Dashboards for Different Stakeholders
A one-size-fits-all dashboard is a recipe for confusion. Effective reporting is all about delivering the right information to the right person in the right format.
Tools like Google Looker Studio are perfect for this, letting you build customized, live dashboards that pull data from various sources into a single, easy-to-digest view.
Here’s how you can tailor dashboards for different roles:
- For the CEO or Business Owner: They care about the bottom line. Their dashboard should be a simple, high-level overview focused on business outcomes. Key metrics include Total Marketing ROI, Customer Acquisition Cost (CAC), and Customer Lifetime Value (CLV). Use simple line graphs and big, bold numbers to show trends over time.
- For the Marketing Manager: They need the full story to manage campaigns effectively. Their dashboard should be more detailed, breaking down performance by channel. It should include metrics like Return on Ad Spend (ROAS) for paid campaigns, Lead Conversion Rate from organic search, and Cost Per Lead (CPL) across all channels.
- For the Channel Specialist (e.g., SEO or PPC Manager): This is where you get granular. An SEO specialist needs to see keyword rankings, organic traffic trends, and backlink growth. A PPC manager needs to monitor Click-Through Rate (CTR), Cost Per Click (CPC), and conversion data for specific ad groups.
Below is an example of what a Google Looker Studio dashboard can look like, blending various data points into a clear visual report.

This kind of visualization allows stakeholders to quickly spot trends in traffic, user engagement, and conversions without getting lost in endless rows of data.
Building a Narrative with Your Monthly Report
A monthly performance report should do more than just present numbers; it needs to tell a story. Your report should answer three simple but critical questions:
- What happened?
- Why did it happen?
- What are we going to do next?
A great report doesn't just show data; it provides a narrative. It connects the dots between your marketing actions and the business's results, turning metrics into a roadmap for the future.
This approach is crucial because proving the value of marketing remains a significant challenge. Proving ROI is the top hurdle for 83% of marketers, yet data-driven organizations are 6% more profitable than their competitors. Consistently showing the connection between marketing efforts and business outcomes is essential, especially when up to 30% of marketing budgets are often wasted on ineffective strategies.
Establishing a Consistent Reporting Cadence
Finally, consistency is key. A regular reporting cadence—whether weekly, bi-weekly, or monthly—creates a rhythm for your team. It ensures that you are constantly tracking progress, identifying issues before they become major problems, and spotting opportunities for optimization.
This consistent loop of Measure > Report > Analyze > Optimize is the engine of a successful digital marketing program. It guarantees that your strategy is always evolving based on real-world performance data, not just assumptions. This is how you confidently answer the question, "Is our marketing working?" and know exactly what steps to take next.
If you're looking to dive deeper into the financial side, check out our guide on how to calculate marketing ROI for a detailed breakdown.
Your Questions, Answered
Navigating the world of digital marketing analytics can feel like learning a new language. Here are some straightforward answers to the questions we hear most often from business owners, designed to help you get a real handle on measuring what matters.
How Often Should I Check My Marketing Performance?
The honest answer? It depends entirely on the channel and your goals. This isn't about staring at a dashboard all day; it's about strategic check-ins.
For something fast-moving like a Google Ads or Facebook campaign, you'll want to be in there daily or at least every other day. You're watching things like Cost Per Click (CPC) and Click-Through Rate (CTR) to spot problems early and make sure you're not burning through your budget on a bad ad.
On the other hand, for a long-term play like SEO, checking in weekly or even monthly is much more practical. You need a longer timeframe to see real movement in things like organic traffic and keyword rankings. Looking at it daily will just drive you crazy.
We always recommend a big-picture monthly performance review across all your channels. It’s the perfect cadence to spot meaningful trends, see which channels are pulling their weight, and make smart strategic decisions without getting bogged down in the daily noise.
What Are The Most Important Metrics for a Service Business?
For a local service business—think plumbers, lawyers, or contractors—you need to track the metrics that lead directly to new business. Forget vanity metrics like website visitors and focus on actions that mean a potential customer is trying to contact you.
These are the KPIs that truly matter:
- Phone Calls: Track every single call coming from your website, your Google Business Profile, and your paid ad extensions.
- Form Submissions: This means every "Request a Quote," "Schedule a Consultation," or "Contact Us" form that gets filled out.
- Local Search Visibility: Keep an eye on your rankings for your core service-area keywords, like "plumber in Baltimore MD."
- Google Business Profile Actions: In your GBP insights, look at clicks-to-call and direction requests. These signal someone with very high intent to hire.
These metrics provide a clear, undeniable line from your marketing spend to the number of leads in your pipeline.
How Can I Measure ROI with a Long Sales Cycle?
This is a common challenge for businesses like B2B software companies or high-end contractors where a "sale" can take months. The key is to stop focusing only on the final signed contract and start tracking the critical steps along the way. You need to connect your marketing data to a CRM and track micro-conversions.
Instead of waiting for the final sale, track progress indicators like:
- Whitepaper or case study downloads.
- Webinar registrations.
- Demo requests or free trial sign-ups.
You can then assign a projected lead value to these actions based on your historical close rates. This lets you calculate a leading-indicator ROI long before the deal closes. A CRM is non-negotiable here; it’s what allows you to connect that initial website visit from six months ago to the revenue it eventually generated, giving you the true, long-term picture.
What is the difference between KPIs and metrics?
Think of it like this: all KPIs are metrics, but not all metrics are KPIs. A metric is simply a number that measures something—website visitors, page views, or bounce rate. There are hundreds of them. A Key Performance Indicator (KPI) is a very specific metric that you have chosen to measure how effectively you are achieving a key business objective. For example, 'website visitors' is a metric. But 'qualified leads from organic search' is a KPI because it directly ties to the business goal of generating more sales.
Ready to stop guessing and start making data-driven decisions? The team at Raven SEO specializes in creating and executing marketing strategies with clear, measurable outcomes. We help businesses in Baltimore and beyond understand their data and turn insights into revenue. Schedule your no-obligation consultation today and let's build a practical roadmap for your growth.